Winter is going to hit us hard this week. The image below will explain why:
The Red line that is extending its way into the Alabama and Mississippi is the 540 pressure line of the upper atmosphere. This line is equivalent to roughly 32 degrees at the surface. It is generally pretty impressive to have that line extend that far south, but what is more amazing is the 510 pressure line. This line is usually associated with extremely cold temperatures that can easily dip below freezing with wind chills in the negative double digits. That 510 line of air usually hangs around in northern Canada. If it ever rears its ugly head it would usually affect only the states of North Dakota, South Dakota, Minnesota, and Wisconsin. This extremely cold air looks like it will be sticking around for the next couple of days. The brunt of that air should exit the region by January 25th, which is when we may see our first shot of precipitation for much of the Midwest pending any lake effect snow that may happen.
I know it is the middle of winter and everyone is most certainly prepared but here are some essential items if you need to trek around campus or walk for your car to the office.
I hope everyone has a nice week. Stay warm out there the extreme cold will only last a matter of days!
Showing posts with label Stratustatus. Show all posts
Sunday, January 20, 2013
Monday, January 14, 2013
Weekly Weather Update: Jan. 14-21, 2013
For the week of January 14:
An extremely cold air mass has pushed its way southward into the Western and Central United States on Monday. This was a large departure from the unseasonably high temperatures experienced by much of the Eastern half of the country. The sharp temperature contrast between these two air masses can clearly be seen extending from Texas and into E. Canada on the 850 millibar temperature chart below:
Along this steep temperature gradient, persistent rainfall is expected to occur in areas west of the Appalachian from Monday through Wednesday. A strong high pressure located in the Atlantic will block the eastward progressing trough, allowing for moisture from the Gulf of Mexico to funnel its way into areas such as Louisiana, Tennessee, Kentucky, Virginia, and West Virginia. The overrunning moisture along the frontal boundary will bring moderate to heavy rainfall, likely leading to localized flooding issues in these areas. Below is the three-day quantitative precipitation forecast from the HPC:
Into the weekend, latest models hint at a low pressure system developing in the Alberta province and swinging southward into northern Minnesota, Wisconsin, and Michigan. Moderate snowfall and gusty winds could be expected within this region on Saturday/Sunday. The storm can be seen in central Wisconsin on this four-panel chart for Saturday afternoon:
Stratustatus will keep you posted on all the potential weather events this week. Follow us on Twitter and Facebook.
Have a good week!
Monday, January 7, 2013
Saturday, January 5, 2013
The Status of the Stratus
I will have to write this rather quick due to the fact I have some errands to run in the next hour so here me out. Stratustatus is moving along as we continue to bypass obstacles that may have set us back a little. We are begining to understand how the business environment operates and it is a great learning experience.
Stratustatus will hopefully have some form of a logo next week (fingers crossed). We have also went along with the addition of a splash page through the website Launchrock. This site is a very neat way to assist in the promotion of you business startup. The look of and user interface of this page is not the best and will get better I promise.
This semester looks to be a tough one with the amount of credits (20) that I will be taking. We also hope to launch this application by the end of this semester. I will have a good idea of a launch date when more progress has been executed. That being said the Stratustatus Team will be busting our butts to make our weather app sucessful.
We are possibly planning to let some individuals test the app before its release to recieve honest and genuine opinions about its user interface, mobility, and flow. This will be a crucial in the output of our final project. Lastly, we plan on getting some promotional events developed around our launch date.
For anyone that reads this I thank you for your interest in our company. More updates will be given in the upcoming weeks. Be sure to sign up on our webpage here as a way to express your interest in BETA testing.
Thanks for all the support,
Nick Hesterman
CEO of Stratustatus LLC
Monday, December 24, 2012
Christmas 2012 Storm on the Horizon
Merry Christmas Eve, folks! As most of you have heard in the chaos of shopping and wrapping presents, a significant severe weather and snow event threatens a large portion of the U.S. this week. This storm will have major impacts with heavy snowfall amounts, strong winds, and even a potentially major tornado outbreak in the Gulf Coast states on Christmas Day.
We'll first begin discussing the formation of this potent weather system. An impressive upper-level trough is currently working its way across the Rockies, deepening as it progresses over the leeward side of the mountains. As this cold air moves southward and contacts warm Gulf air early Tuesday morning, significant amount of energy is present for the low pressure to intensify near the Mexico/TX border. Also, the presence of ample moisture will enable heavy snowfall and the tornado/severe weather threat.
The number one concern from this system is the severe storms to occur in
the Gulf states on Tuesday and into Wednesday morning. The Storm
Prediction Center's convective outlook for Christmas Day shows a
moderate risk area from central Louisiana extending eastward into
west-central Alabama. Extremely strong wind shear and considerable
instability in the warm sector of the low pressure system will be the
main drive behind the potential for isolated supercells supportive of
long-track tornadoes. Along with supercells capable of tornadoes,
possible bowing storms will also lead to very damaging winds. Based on
simulated radar reflectivities, the severe storms appear to begin in the
morning hours of Tuesday and continue through the evening. Residents of these areas should keep informed throughout the day on any severe weather watches and warnings issued by the National Weather Service.
On the opposite end of the weather spectrum, snowfall will also be a major concern for those traveling in the Midwest and Northeast this holiday. Excessive snowfall potential has already led to the issuance of winter storm watches and warnings extending from Oklahoma northeastward towards northwest Ohio and southern Michigan. Snow will likely start falling in Oklahoma early Christmas morning, and will track northeastward into Thursday. The 12Z NAM output shows snowfall depths up to 16" in some areas of the storm track. However, these snowfall amounts are likely overestimated. With the energy and moisture extracted from the Gulf by the highly-probable severe storms in the South, snowfall amounts should remain lower than what is currently forecasted by many models. Totals for much of the areas within the snow swath should remain below 12", with higher amounts possible in the higher elevations of the Appalachians. At any rate, people should exercise extreme caution if traveling on the roads on Tuesday through Thursday. At the airport, expect many delayed and cancelled flights due to this system. Also, be sure to stay tuned to any watches or warnings issued for your area by the National Weather Service.
As with any weather event, follow Stratustatus on Twitter and Facebook below for continuous updates throughout this significant Christmas storm. Happy holidays, and stay safe out there!
![]() |
| 12Z NAM run for 12Z December 25, 2012 courtesy of PSU Ewall |
![]() |
| Day 2 SPC Convective Outlook Categories and Probabilities |
![]() |
| 12/24 12Z NAM Snow Depths courtesy of WeatherBell |
As with any weather event, follow Stratustatus on Twitter and Facebook below for continuous updates throughout this significant Christmas storm. Happy holidays, and stay safe out there!
Thursday, December 20, 2012
Winter Storm Update: 2:15 PM EST Dec. 20, 2012
The first significant winter weather system for the Midwest is currently underway. This event has prompted blizzard and winter storm warnings in states such as Oklahoma, Nebraska, Iowa, Illinois, and Wisconsin. Along with white-out conditions, areas in the South have seen severe weather including damaging winds and tornadoes.
Current MSL pressure analysis from the SPC Mesoanalysis shows the deepening low pressure of 984 hPa located over north-central Illinois progressing northwestward. The black lines (known as isobars, or lines of equal pressure) along the western side of the storm are seen very close to one another; this indicates winds at the surface are beginning to strengthen. Wind speeds of 53 mph have been reported at the Davenport, IA airport. Of course, cold air associated with these gusty winds has allowed for heavy snowfall to occur, prompting blizzard conditions in Iowa and Wisconsin (MCD 2193).
Heavy snowfall will continue to occur for the Wisconsin area throughout the evening. Rainfall that is currently occurring the Chicago metro will gradually switch over to frozen precipitation in the next few hours, creating an extremely hazardous rush hour commute. Snowfall in Wisconsin and northwest IL could exceed 12" in some areas. As for areas south of the Chicago area, snowfall amounts should be limited to the 2-4" range. Lake-enhanced snowfall is likely to occur in the early morning hours of Friday, 12/21 in northern Indiana and western Michigan.
Here's a video looking at the blizzard conditions as of 10 AM this morning: http://youtu.be/nAtQc-LQV50
Continue to follow Stratustatus on our media outlets below for updates throughout the afternoon and evening on this major winter event:
Twitter
Facebook
Current MSL pressure analysis from the SPC Mesoanalysis shows the deepening low pressure of 984 hPa located over north-central Illinois progressing northwestward. The black lines (known as isobars, or lines of equal pressure) along the western side of the storm are seen very close to one another; this indicates winds at the surface are beginning to strengthen. Wind speeds of 53 mph have been reported at the Davenport, IA airport. Of course, cold air associated with these gusty winds has allowed for heavy snowfall to occur, prompting blizzard conditions in Iowa and Wisconsin (MCD 2193).Heavy snowfall will continue to occur for the Wisconsin area throughout the evening. Rainfall that is currently occurring the Chicago metro will gradually switch over to frozen precipitation in the next few hours, creating an extremely hazardous rush hour commute. Snowfall in Wisconsin and northwest IL could exceed 12" in some areas. As for areas south of the Chicago area, snowfall amounts should be limited to the 2-4" range. Lake-enhanced snowfall is likely to occur in the early morning hours of Friday, 12/21 in northern Indiana and western Michigan.
Here's a video looking at the blizzard conditions as of 10 AM this morning: http://youtu.be/nAtQc-LQV50
Continue to follow Stratustatus on our media outlets below for updates throughout the afternoon and evening on this major winter event:
Monday, November 26, 2012
Winter is on its way
One of the greatest times of the season is Thanksgiving. Between the Turkey, Football, and the fight for Black Friday deals a wave of Winter has decided to make its way into the Midwest and Northeast this holiday weekend. The upper Great Plains and Montana have already been battling winter's wrath with Blizzard and Winter Storm warnings punishing the region. Now I can honestly say that the winter season is here to stay for Midwestern and Northeastern families.
Our Thanksgiving Day in Indiana was beautiful. We experienced temperatures reaching upwards of 60 degrees with excess amounts of sun. It was perfect weather to go out and throw the football, eat food, drink beverages, and have a great time. During the late evening hours a low front bullied its way through the Midwest with rain and clouds, which led to a drastic temperature change for Friday.
Friday was a brutal welcoming of Winter with snow flurries invading the region. Also, the first bouts of lake effect snow hit home in Ohio, Pennsylvania, and upstate New York. Is this just a precursor to the winter we will receive? Only time will tell.
We will be posting on weather related discussing later this week.
Thanks,
The Stratustatus Team
We will be posting on weather related discussing later this week.
Thanks,
The Stratustatus Team
Sunday, November 18, 2012
Been so long
We are writing in to apologize for our blog hiatus. All of us were extremely caught up in tough coursework like Synoptic and Physical Meteorology. We vow to become more productive on our blog over the next few months. Stratustatus is working extremely hard to get out potential app off the ground. Thanks for all of the support and we will keep you updated on the what's to come.
Thursday, September 20, 2012
Cool Temps for the East: Teleconnection Influences
Despite the official meteorological start of Autumn still being a few days away, the majority of the East Coast has already been feeling the cool temperatures this week. The passage of two strong cold fronts left overnight temperatures in the mid to upper 30s on Tuesday evening for much of the Great Lakes region. In Northern Minnesota, overnight temperatures dropped below 30 degrees, prompting freeze warnings for much of the area. It's quite an amazing flip from the unbearable heat we all experience this summer. Now you might be wondering what is causing this swift change in weather; the answer is lies within shifts in teleconnection patterns
A teleconnection is a statistical linkage between climate anomalies over a large distance. These linkages interact with each other in various ways, shifting between positive and negative phases, and ultimately affecting weather and climate patterns for certain parts of the world. Phase shifts for most of these teleconnection patterns can be observed in changing sea surface temperatures for lengths of time. The two teleconnection patterns we will be focusing on with regards to the Eastern U.S. cool down will be the North Atlantic Oscillation (NAO) and the Arctic Oscillation (AO).
The North Atlantic Oscillation

The NAO is a fluctuation in differences between the semi-permanent pressure features in the Atlantic known as Azores High and the Icelandic Low. In the positive phase of the NAO, the two pressures strengthen, increasing the strength of the jet stream. The strong jet stream prevents cold air from the Arctic intruding southward into lower latitudes, keeping the Eastern U.S. warm and wet. In the negative phase, the Azores High and Icelandic Low weaken, in turn weakening the jet stream and increasing the amplitude of troughs and ridges. The increased meridional flow can promote a blocking pattern, keeping a trough located over the eastern half of the country.
We are currently in a negative phase of the NAO, resulting in the intrusion of Arctic air into the Great Lakes and Northeast regions of the United States. This negative phase has also resulted in a well-established a blocking pattern in the jet stream, keeping this cold air in the region. Below is a look at the current 500 millibar heights showing this pattern:
The Arctic Oscillation

The AO is related to the pressure differences in the Arctic and midlatitudes. During the positive phase (pictured on the left in the above graphic), strong low pressure in the polar region strengthens the east-west flow of the jet stream, locking cold air in the Arctic regions. When the AO shifts into a negative phase, zonal flow of the jet stream weakens and allows for cold air to move into the midlatitude regions.
Above is the current AO index. Currently, the AO is also in a negative phase, indicating strong polar air infiltration into the U.S. This, in combination with the negative NAO phase has resulted in the prolonged below normal temperatures for the Great Lakes, Upper Midwest, and Northeast. The blocking pattern appears to persist for the next week, bringing waves of Arctic air into these regions. Below is the five day temperature anomaly including this coming weekend.

However, forecast models are indicating a shift in these indices, leading to the return of slightly warmer air in the later half of the 0-16 forecast period. Below is showing the five day temperature anomaly two weeks out.

Graphics courtesy of WeatherBELL Models, the Climate Prediction Center, and NSIDC.
A teleconnection is a statistical linkage between climate anomalies over a large distance. These linkages interact with each other in various ways, shifting between positive and negative phases, and ultimately affecting weather and climate patterns for certain parts of the world. Phase shifts for most of these teleconnection patterns can be observed in changing sea surface temperatures for lengths of time. The two teleconnection patterns we will be focusing on with regards to the Eastern U.S. cool down will be the North Atlantic Oscillation (NAO) and the Arctic Oscillation (AO).
The North Atlantic Oscillation
The NAO is a fluctuation in differences between the semi-permanent pressure features in the Atlantic known as Azores High and the Icelandic Low. In the positive phase of the NAO, the two pressures strengthen, increasing the strength of the jet stream. The strong jet stream prevents cold air from the Arctic intruding southward into lower latitudes, keeping the Eastern U.S. warm and wet. In the negative phase, the Azores High and Icelandic Low weaken, in turn weakening the jet stream and increasing the amplitude of troughs and ridges. The increased meridional flow can promote a blocking pattern, keeping a trough located over the eastern half of the country.
We are currently in a negative phase of the NAO, resulting in the intrusion of Arctic air into the Great Lakes and Northeast regions of the United States. This negative phase has also resulted in a well-established a blocking pattern in the jet stream, keeping this cold air in the region. Below is a look at the current 500 millibar heights showing this pattern:
The Arctic Oscillation
The AO is related to the pressure differences in the Arctic and midlatitudes. During the positive phase (pictured on the left in the above graphic), strong low pressure in the polar region strengthens the east-west flow of the jet stream, locking cold air in the Arctic regions. When the AO shifts into a negative phase, zonal flow of the jet stream weakens and allows for cold air to move into the midlatitude regions.
Above is the current AO index. Currently, the AO is also in a negative phase, indicating strong polar air infiltration into the U.S. This, in combination with the negative NAO phase has resulted in the prolonged below normal temperatures for the Great Lakes, Upper Midwest, and Northeast. The blocking pattern appears to persist for the next week, bringing waves of Arctic air into these regions. Below is the five day temperature anomaly including this coming weekend.
However, forecast models are indicating a shift in these indices, leading to the return of slightly warmer air in the later half of the 0-16 forecast period. Below is showing the five day temperature anomaly two weeks out.
Graphics courtesy of WeatherBELL Models, the Climate Prediction Center, and NSIDC.
Tuesday, September 18, 2012
The Man Known as Mr. Tornado
Tetsuya Fujita was born in Kitakyushu City, Japan
on October 23, 1920 (Notable). He displayed critical thinking at a very young age
(Rosenfeld 24). Supposedly his teacher one day in class
discussed a picture of a monk, who spent 30 years digging a tunnel (Rosenfeld
24). Fujita cleverly stated that he would have spent
15 years building a burrowing machine and the other 15 years digging that
tunnel (Rosenfeld 24). This would have left a tool for humanity along
with the tunnel (Rosenfeld 24). Little
did he know that someday he would generate great advancements in Meteorology.
Fujita received his collegiate schooling from Meiji College in
Kyushu(Notable). Although he majored in engineering, Fujita really enjoyed the
sciences (Notable). This love for geology,weather, and math benefited the
atmospheric science field forever (Notable).
Fujita’s discoveries were part of a process that developed over a long period
of time. He began to examine severe storms at the age of
27 (Rosenfeld 20). This was when he started plotting the direction
of cloud-to-ground lightning (Rosenfeld 20). He
would also record the time between the lightning flash and its thunder
(Rosenfeld 20). This study concluded that thunderstorms had
three lightning coordinates of activity (Rosenfeld 20). The
next study was over his analysis of the severe thunderstorms theory. Fujita
began to graph paths of storms and taught himself how to draw many different
kinds of cartography figures (Rosenfeld 20). He
would immerse himself in the storm to record barometric
pressures (Rosenfeld 21). Low
barometric pressures are associated with storm activity while higher-pressure
readings correlate with calmer atmospheric conditions. His
study found that barometric pressure rose during the dissipating stage of a
thunderstorm, which correlates with higher pressure (Rosenfeld
21). This went against the initial theories that
stated storms were mostly composed of low pressure (Rosenfeld 21). This
find grabbed international attention, especially
from meteorologists in the United States. His
graphing skills along with basic weather tools led to the “Thundernose Concept”, which
took the American Thunderstorm Project millions of dollars to understand
(Rosenfeld 21).
After his move to Chicago, Ted Fujita and Morris Tepper developed Mesoscale
Meteorology (Rosenfeld 21). This
is the research and analysis of atmospheric fronts up to the size of 600 miles
wide (Rosenfeld 21). This focused his studies on the complexity of
thunderstorms along with squall lines (Rosenfeld 21). Squall
lines are a specific type of thunderstorm that usually contain very high wind
speeds. He would graph these systems and analyze the
positioning of the dots with mathematical equations (Rosenfeld 21). These
extensive studies led him to pioneer updraft and downdraft radar (Rosenfeld 21). Downdrafts
indicate a weakening or final stage of the storm system. Sometimes high
winds are associated with downdrafts. Updrafts indicate unstable air that lead
to cumulonimbus clouds and storm development.
This new sub-field of meteorology contained the theories of downbursts and
microbursts. He first encountered this concept during his
investigative research into the Atomic bombings of Japan (Rosenfeld 22). He
theorized of straight-line vertical winds hit the earth’s surface and
forcefully made it’s way through the cities of Hiroshima and Nagasaki
(Rosenfeld 23). Atmospheric downbursts and microbursts are
scaled down versions compared to the atomic bomb (Rosenfeld 22). He
named this a sub-category of wind due to its intensity and potential danger to
the public. Naming microbursts and downbursts as a form of
wind promoted greater awareness of the phenomena.
In 1971, Fujita’s interest in tornados led to the creation of the Fujita
Tornado Scale, which was his biggest contribution to atmospheric science
(McDonald 63). This scale was needed to create both a database
of tornados as well as to earmark extreme velocities of tornados. This
understanding would aid in making buildings more wind resistant (McDonald
64). Fujita decided to separate tornadoes into six
different categories. F0/F1 tornados represent light to moderate
damage with winds between 18-50m/s (Fujita Scale). F2/F3
tornados represent considerable to severe damage with winds between 51-92m/s
(Fujita Scale). F4/F5 tornados are the most catastrophic, with
winds starting around 93m/s and top out at up to 142m/s (Fujita Scale).
A tornado is a very difficult weather phenomena to track. The
small sizes of these storm systems make them nearly impossible to record with
weather stations. Before the contributions of Fujita, the
only tornado climatology studies conducted were mappings and calculations of
the number of tornadoes per year for counties, states, and
regions (Forbes 74). Fujita compiled physical descriptions of damage
and debris that correlated with wind speeds of a tornado (McDonald 65). These
descriptions were then used to create a tornado database (Forbes 75). Fujita, along
with his staff, went back as far as 1916 to begin the
classification of cited tornados as well as their mapped paths (Forbes 74).
The development and perfection of the Fujita
scale was a time consuming process. Fujita, the
weather detective, admitted that there are potential flaws to the
system (McDonald 66). The variables include the damage assessment of a
tornado in an open field and the quality of building structures (McDonald 66). He
also noted the maximum F-scale wind only effects a small percent of the total
damage area (Forbes 75). In
order to understand wind speed velocities Fujita, along with his colleges,
conducted aerial surveys where they would take photographs of the damage area
(Forbes 74). Fujita and his staff conducted over 300 aerial
damage trips (Rosenfeld 23). He
then applied photogrammetry to the pictures he took on these surveys (Forbes
73). Photogrammetry is the art of making maps and
calculations from photographs and even satellite imagery (Forbes 73). From
these calculations Fujita developed a table that represented the F-scale damage
percent of each F-scale tornado (Forbes 75).
One of the notable tornado outbreaks Fujita researched was the Palm Sunday
Outbreak of April 11-12, 1965 (Snow). This was when the multiple vortex tornado
theory was developed (Snow). The multiple vortex tornados contain a system of
smaller tornados wrapping around a common central point (Snow). This storm
outbreak killed 260 while injuring another 3,400 people (Palm Sunday Outbreak).
There were a total of 51 tornados that brought a damage toll to over 200
million dollars (Palm Sunday Outbreak).
Once the Fujita scale was implemented there was a drastic rise in tornado
frequency (Forbes 75). He and many others credit the spike in tornado
frequency along with the decreased fatality rate to the drastic increase in
public awareness of tornado activity (Forbes 75).
Fujita’s meteorological
innovation spanned his whole life. His
thought process consistently produced ideas such as Mesoscale meteorology, downbursts, and
microbursts, which ultimately led to the Fujita Scale system. He
had strong math, critical thinking, and
graphing skills. Unlike most meteorologists Fujita did not rely
on computers to do the analysis (Chicago). He was
quoted for saying, “Computers don’t understand these things”
(Chicago). He contributed 43 years of service to the field
of meteorology. He was a brilliant inventor that continued to do
research until his death in 1998 (Chicago).
Works Cited
- Forbes, Gregory S., and Howard B. Bluestein. "Tornadoes, Tornadic Thunderstorms, and Photogrammetry: A Review of the Contributions by T. T.” Bulletin of the American Meteorological Society 82.1 (2001):73. Academic Search Premier. EBSCO. Web. 23 Jan. 2011.
- “Fujita scale." Columbia Electronic Encyclopedia, 6th Edition (2010): 1. Academic Search Premier. EBSCO. Web. 23 Jan. 2011.
- McDonald, James R. "T. Theodore Fujita: His Contribution to Tornado Knowledge through Damage Documentation and the." Bulletin of the American Meteorological Society 82.1 (2001): 63. Academic Search Premier. EBSCO. Web. 23 Jan. 2011.
- “Palm Sunday Outbreak.” Nationalgeographic.com. 1996. National Geographic. Web. Feb 9. 2011.
- Rosenfeld, Jeff. "Mr. Tornado." Weatherwise 52.3 (1999): 18. Academic Search Premier. EBSCO. Web. 20 Jan. 2011.
- Snow, Justin. “T. Theodore Fujita.” Britannica.com. Web. Feb 9. 2011
- “Tetsuya Fujita.” Notablebiographies.com. Advameg, Inc. Web. 24 Jan. 2011.
- “Tetsuya “Ted” Fujita, 1920-1998.” Uchicago.edu. Jun 14. 2000. University of Chicago. Web. Jan 24. 2011.
Sunday, September 16, 2012
Indiana Weather: Case Study:(September 13-14, 2012)
Between
Thursday, September 13, 2012 and Friday, September 14, 2012, a weak storm
system pushed through Indiana. This particular system did not produce and
severe weather, however, it brought some needed showers for Indiana’s dry soils.
The most recent drought monitor, retrieved from www.drought.gov,
shows that the majority of Indiana is still under D1 Category, indicating
moderate drought, and areas to the south are seeing severe drought (D2).
![]() |
| Figure 1: Drought Monitor (September 11, 2012) www.drought.gov |
In Figure
2 (Surface Map Image), a dome of high pressure dominated over the east coast
and into Indiana on September 12, 2012 during the evening (Approximately 8:15pm
EDT). There was also a well-defined cold front pushing its way through Iowa,
Illinois, Missouri, and Kansas bringing showers to those states. Notice in the Infrared Satellite, the cloud cover associated with these lines for storms.
![]() |
| Figure 2: Surface Map : September 12, 2012 (8:15pm EDT) |
![]() |
| Figure 3: Infrared Satellite September 12, 2012 (8:01 pm EDT) |
By 8:15
pm EDT September 13, 2012, the cold front enters Indiana with showers closely
behind in Illinois (Figure 4). On the 850 mb map (approx. 1 mile above the
surface), you can see the defined frontal boundary, Gulf moisture feeding into
the system, and the cold air influence from Canada. (Arrows on Figure
5 show
this).
![]() |
| Figure 4: Surface Map September 13, 2012 (8:15pm EDT) |
| 850 mb Map: September 13, 2012 (8:00 pm EDT) |
The rain finally arrived overnight, and by 8
am September 14th, the system became a bit more unorganized at the
surface by the morning (Figure 6). The cold front had turned stationary, which
left lingering showers in the area throughout the morning and early the
afternoon hours. By that evening, high
pressure dominated the Indiana/Illinois region (Figure 7 ), once again, and the
front pushed away toward the east coast.
![]() |
| Figure 6: Surface Map September 14, 2012 (8:15 am EDT) |
![]() |
| Figure 7: Surface Map September 14, 2012 (8:15 pm EDT) |
This low pressure system did not
cause any severe weather and there were no severe weather reports, according to
the Storm Prediction Center’s website (www.spc.noaa.gov). After analyzing the
300mb chart, the polar jet stream stayed to the north, which is one possibility
on why this front did not produce any thunderstorms because of the lack of wind
shear (Figure 8).
![]() |
| Figure 8: 300 mb September 12, 2012 (8:00 am EDT) |
Another reason that this system could’ve been weak was how
the front became disorganized when it was residing over the state. Overall, this
might have been a weak system to move through Indiana however, every little bit
counts when the state is trying to recover from the exceptional drought that
occurred last summer.
Surface Map Images and Upper Level Maps retrieved from: http://weather.unisys.com/archive/index.php
Monday, September 10, 2012
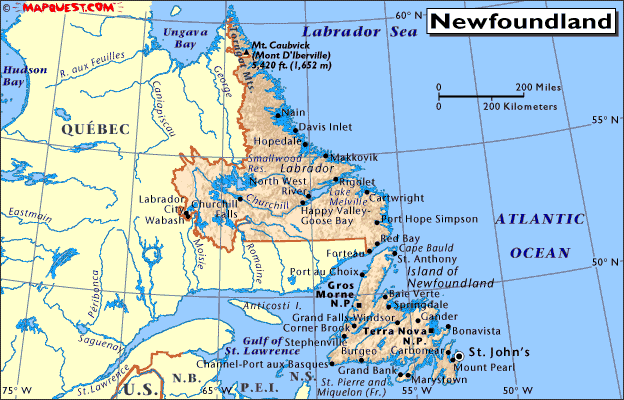
Impact of TS Leslie on Newfoundland & Labrador
This Atlantic Hurricane Season continues to surprise as Tropical Storm Warnings have been issued along the coasts of Newfoundland. It is not that uncommon but we would like to analyze it impact on the region over the next 24 hours.
- Canadian Province: Newfoundland and Labrador
- Population: 500,000+
- Primary City Impacted: St. John's, Newfoundland
- Population: Metro: 196,000+
- Tropical Storm Leslie
- Maximum Wind Speeds: 70mph
- Wind Gusts: 85mph
- Movement: NNE at 31mph
The rapid rise of elevation should help reduce inland flooding. Tropical Storm Leslie will move past rapidly and looks maintain its intensity over the next 36 hours. The speed to the storm will lead to minimal residence time over the island. The precipitation map from Hamweather.net states that 24-hour precip will vary from 1-5 inches across the island. Leslie will make landfall this morning and will then travel to Iceland as a 60mph tropical storm.
Sunday, September 9, 2012
Hurricane Preparedness
September
10th marks peak season for hurricane development in the Atlantic Ocean and Gulf
of Mexico. Many people living along or near the East and Gulf Coasts of the United
States should really consider creating a disaster plan for their families and
themselves if you already don’t have one!
The
first step for hurricane preparations would be to plan different routes if you
and your family had to be evacuated for an approaching hurricane or tropical
storm. Deciding to evacuate can be a difficult decision and typically has to be
made within a short time span. Traffic pile-ups often sway an individual’s
decision on whether to evacuate or not, which is why planning a route is
beneficial to avoid horrible traffic jams. Also, planning a safe destination,
whether in a hotel or other family member’s home, is vital for a successful
evacuation. This ensures you and your family’s safety when you finally arrive
at the preplanned location.
|
Figure 1 www.nytimes.com (Damage Hurricane Ike)
|
Creating
a survival kit is another must if you are in a disaster (hurricane or not!)
prone area. During severe weather events, many homes and businesses lose their
power, which means one has to plan their food choices and water supply accordingly.
The American Red Cross’s website offers lists of various supplies that are
necessary to include in you survival kit. The first list includes the most
basic supplies that are highly recommended, and also include secondary lists
that would be beneficial to you and your family’s needs. It is highly suggested
that you check out the American Red Cross’ website and create a survival kit
just in case of an event of a disaster (or hurricane).
Website for the American Red Cross: http://www.redcross.org/prepare/location/home-family
Taking
inventory of your household items is another suggestion you might want to
consider while preparing for a hurricane/tropical storm for insurance reasons.
By doing this, you are providing pictures of your home and personal belongings
before the disaster has occurred. After the storm has passed, you can take
pictures of your items and home after the storm, and present them to your insurance
company. This helps you while you inventory the aftermath, and shows the
insurance companies the actual damages from the storm.
One
of the last tasks one should remember is covering all your windows or opening
to your home. Hurricane shutters are ideal in this situation, but not many
homes or businesses have access to them. Boarding up windows with wood is an
alternative that could help protect your home as well. Placing sandbags around
your home is another way to provide damage prevention to help block possible
flooding and storm surge.
|
Figure 2: Ramanathan | Aug 29, 2012 (Isaac) http://www.ibtimes.com
|
Finally
if you are a pet owner, please do not forget your pet(s)! They too need to be
included in your disaster plan because not all hotels are “pet friendly”, and
pets also need necessary supplies, such as water and food.
Hurricanes
and tropical storms are only two disasters out of many that can occur. Every household,
no matter your location, should make plans for disasters. Businesses also
should consider having disaster plans to protect themselves and their faculty.
A disaster can happen at any time, so it is better to be prepared for when it
happens!
Subscribe to:
Posts (Atom)